Visual Data Analysis
Advertisement
365DiskData(Disk data analysis experts) v.1.0
A powerful explorer-like application for Windows that analyzes disk space utilization.Selecting a disk volume or folder displays a summary of its contents in report or chart format.
Advertisement
ANKHOR FlowSheet v.1.0.4.2768
Advanced Visual Data Processing Tool. ANKHOR FlowSheet is a universal tool for table based data analysis, processing and presentation that overcomes the weaknesses of traditional spreadsheet applications by a revolutionary visual approach.
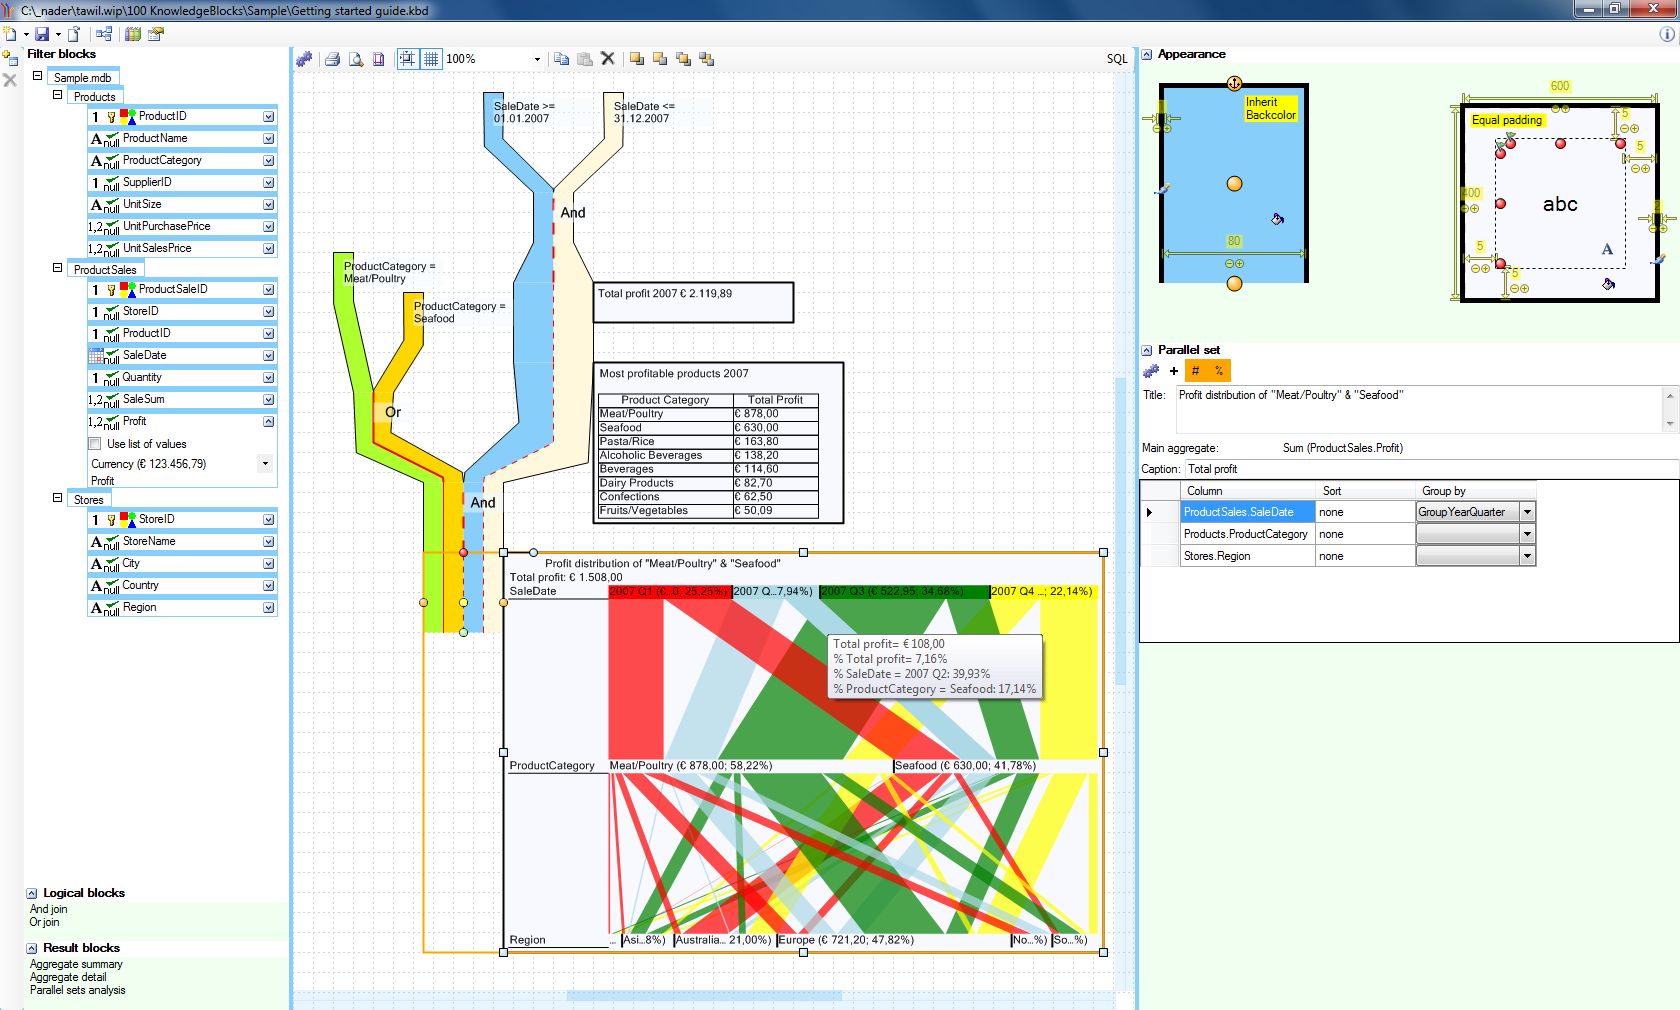
Knowledge Blocks v.1.0
Knowledge blocks is a new type of data analysis software that is designed for non-technical business professionals.
XLSTAT (Win)
XLSTAT is a complete analysis and statistics add-in for MS Excel. It includes regression (linear, logistic, nonlinear), multivariate data analysis (PCA, DA, CA, MCA, MDS), correlation tests, parametric tests, non parametric tests, ANOVA, ANCOVA and much
Tools for Excel Tables
Essential tools for data analysis and tables management for novice and advanced Excel's users. A set of tools that will strengthen your Microsoft Excel to manage data bases and huge tables in your spreadsheets. Tools for Excel Tables is an addin
DataScene Lite
DataScene Lite is a data graphing and data analysis software package. It allows the user to easily plot brilliant 2D & 3D graphs (Area, Bar, Pie, Line, Surface, Polar, etc) with scientific, financial, and statistical data, to manipulate, print, and export
StatistiXL v.1 8
statistiXL is a powerful data analysis package that runs as an add-in to Windows versions of Microsoft Excel.
SimplexNumerica v.13.0.14.1
2D/3D technical graphics plotting and data analysis software for your plotting needs. Curve fitting, FFT and a presentation software! Download a demo of our analysis and plotting software!
QtiPlot v.0.9.8.6
QtiPlot is a program for two- and three-dimensional graphical presentation of data sets and for data analysis. Plots can be produced from data sets stored in tables or from analytical functions.
PSI-Plot v.9.01.0009
PSI-Plot brings flexibility to technical plotting and data analysis. It has a powerful scientific spreadsheet for data analysis, and an object-oriented on screen graphics editor that makes it easy to design and modify graphs.
Total Access Statistics 2010 v.14.0
Total Access Statistics 2010 is the Most Powerful Data Analysis Program for Microsoft® Access® Microsoft Access queries offer basic data analysis.